How dense is your city?
You’ve almost certainly been lied to about how big the world’s cities are.
You’ve almost certainly been lied to after Googling how big the world’s cities are. How can it be that Melbourne in Australia has 5 million residents, whereas New York City only has 8?
The way we define what a ‘city’ differs across countries and cultures. The density of different areas is dependent on essentially random political boundaries. So Australia tends to have huge cities, whereas there are over a dozen cities near NYC that would be considered suburbs in Australia.
It’s impossible to compare the density two cities if we are not comparing apples to apples.
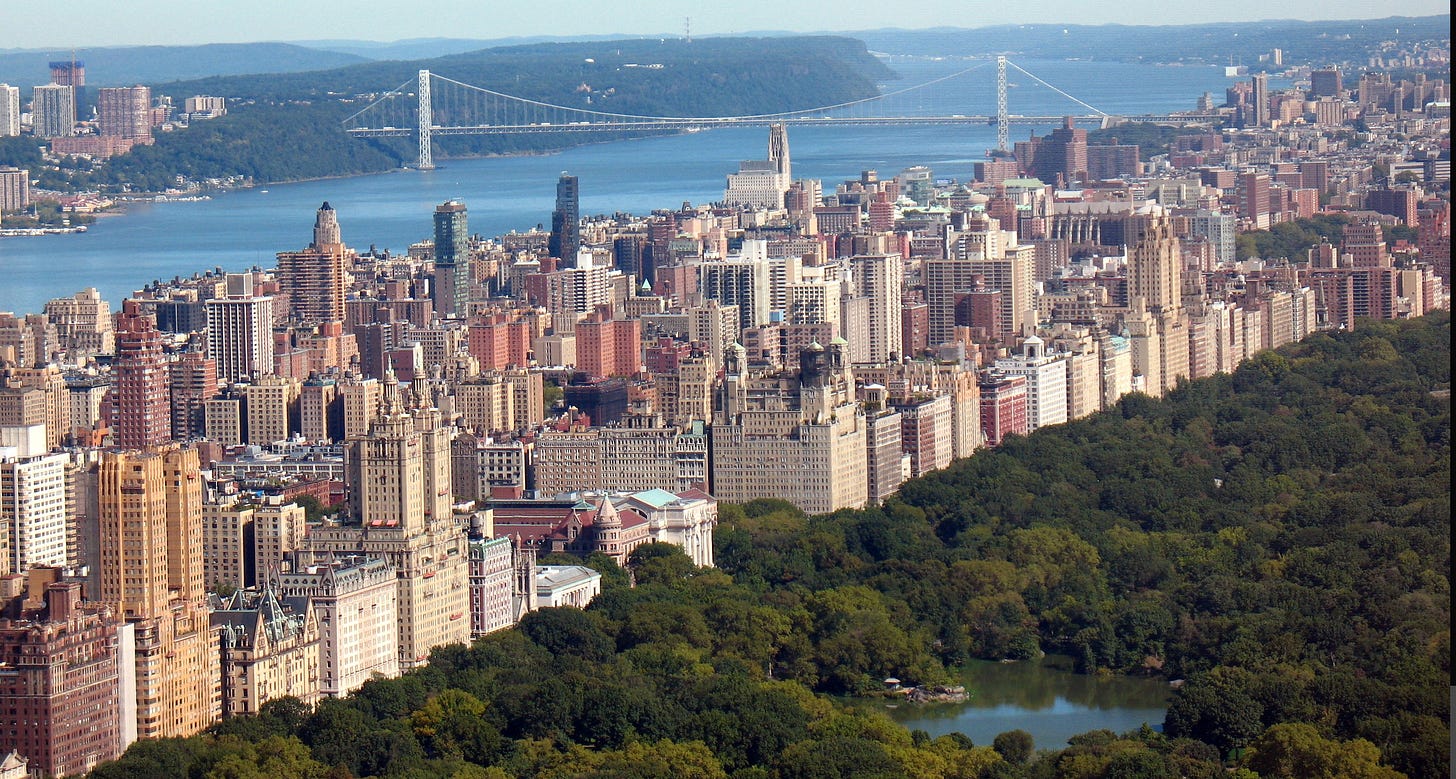
But it’s not just across cities. When we are deciding how dense the upper west side is in Manhattan, should we include central park or not? That choice could halve or double the density of the neighbourhood - but there’s no system in place to do so fairly.

Luckily there is a solution. Today I’m launching CityDensity.com to compare the world’s big cities.
The website works by breaking the world up into tiny squares, with each square having 1km sides. Because the squares are essentially random they’re also fair - no political borders can make a city seem bigger or smaller than it is.
The two best measures of city density are
Population weighted density which measures what it feels like to live in a city - how tall the buildings are and how many people are likely to be on the street.
Population which measures how many people live close by to a city
Compare what it’s like to live in or visit a city - population weighted density
To understand what it feels like to live near or visit a city, look at “population weighted density”. This is a measure of the typical density experienced by a person who lives in a given city. This measure takes account the fact that some cities feel more dense than official statistics show. Their density might be lower because of oceans, mountain ranges, or zoning that concentrate populations in small areas. One example of this is Hong Kong. It is one of the most dense cities in the world but raw density statistics are much lower because of all the mountain ranges and oceans.

Population weighted density represents the typical density experienced by somebody who lives in a given area. It measures how dense the typical neighbourhood is. It is calculated by finding the average population density of each 1km square in a region, weighted towards the squares with a greater population.
Compare the economic pull of a city - population
Cities are more than just a collection of neighbourhoods. When lots of dense areas are grouped together they create dynamism much more than the sum of their parts. While Hong Kong is incredibly dense, Tokyo is dense in every direction and so millions of more people call the city home. To understand the economic power of a city it can be helpful to look at the total number of people who live nearby, without worrying about things like water or mountain ranges.
City Densities lets you select many cities and compare, but if you want to look at a specific point anywhere in the world try out Tom Forth’s amazing website that uses the same data I use here.
Other density measures
I’ve included lots of other density measures on the website. Most of the options show who lives in rings around a given city, while “cumulative” measures consider who lives within the whole area from the center of the city up until that point.
How good is the data?
The team at Global Human Settlement Layer made the map of tiny squares, with data collated from around the world by NASA. Most of the populations are projected forward to 2020 from national censuses. Many of the original data is from around 2010, and so is starting to lose accuracy in fast growing areas. NASA are updating their data in Spring of 2024, and hopefully GHSL will not be far behind. For Australia I’ve overcome this by using the ABS’s 2022 km grid, which is far more accurate for Melbourne and Sydney’s fast growing outer suburbs.


Give us top 10 lists by the different metrics
This just might be the most amazing thing I have found not only for density visualization but also for real estate investing considerations based on population. Have you considered about adding more cities from India?